
.webp)
.webp)

A brand has forty thousand dollars and two proposals: one macro creator with 800K followers, or twenty-two micro creators averaging 30K each. Both decks lead with reach and engagement slides, but neither answers the question the budget actually hinges on. Anyone comparing micro vs macro influencers conversion rate performance runs into the same wall eventually, which is that the industry's own benchmarks don't agree with each other.
That's worth sitting with for a moment, because it isn't a small discrepancy between two obscure studies. It's a gap between the two most widely cited kinds of research in the category, and it explains why so many brands make this call on instinct and then can't defend it afterward.
Why Micro vs Macro Influencers Conversion Rate Benchmarks Disagree
Take two respected sources and put their findings side by side. Influencer Marketing Hub's benchmarks show nano creators averaging around 5.60 percent engagement, micro creators around 2.15 percent, with rates declining steadily as audience size grows. Read that alone and the conclusion is that smaller wins.
Then look at HubSpot's 2026 Social Media Marketing Report, built on responses from more than 1,100 global marketers. Asked which tier delivered the best results, marketers named mid-tier creators in the 100,000 to 499,000 range, at 36.80 percent. Not nano. Not micro. The tier the engagement benchmarks rank near the bottom.
Both findings are sound, but they answer different questions:
- Engagement Rate Measures Reactions Against Followers: It's a ratio, and the denominator grows faster than the numerator as an account scales, so the metric declines with audience size almost as a matter of arithmetic rather than as evidence about audience quality.
- Marketer-Reported Results Measure Outcomes: When practitioners judge what worked, they're weighing revenue, reach, and whether the campaign justified its cost, which is a different question with a different answer.
- Neither Metric Tracks Buying Intent Directly: A like commits nothing and a report card filled in months later smooths over what actually happened in between.
What Are the Benchmarks Actually Measuring?
Engagement rate earned its place honestly. It was the best available proxy when nothing better existed.
The trouble starts when a proxy gets promoted to a verdict. A like costs nothing and says something about the content rather than the product. Saves and shares carry more weight, since they imply an intention to come back. Neither indicates that anyone has decided to buy anything.
A question is different. Someone asking about price, sizing, availability, or delivery timing has crossed from watching into evaluating, and that crossing is the closest observable moment to a purchase decision. Two creators can post identical engagement rates and produce completely different comment sections underneath. One fills with compliments and fire emoji. The other fills with people asking where to get it and whether it comes in another color. Nothing in standard influencer tier benchmarks distinguishes those two outcomes, though the second is worth considerably more.
Which Tier Produces the Most Buying Conversations?
Mid-tier creators occupy a useful middle ground where the audience is still specific enough to be in-market yet large enough to produce meaningful volume. Several structural factors drive conversation volume, and follower count is only one of them. Other key factors include:
- Perceived Reachability: Audiences of smaller creators believe a reply is possible, and often it is, so they ask. Nano influencer performance on conversation volume tends to outrun what the reach figures would predict.
- Category Specificity: A creator focused on one niche attracts an audience already in-market for that niche, which means a higher share of any given impression was a genuine candidate to buy.
- Content Format Over Tier: A Reel and a static post from the same creator can differ several times over on engagement, so format choices often matter more than which tier a creator sits in.
- Audience Breadth Working Against You: Macro reach includes a large share of people who were never going to buy, which drags conversion percentages down without saying anything about the creator's ability to sell.
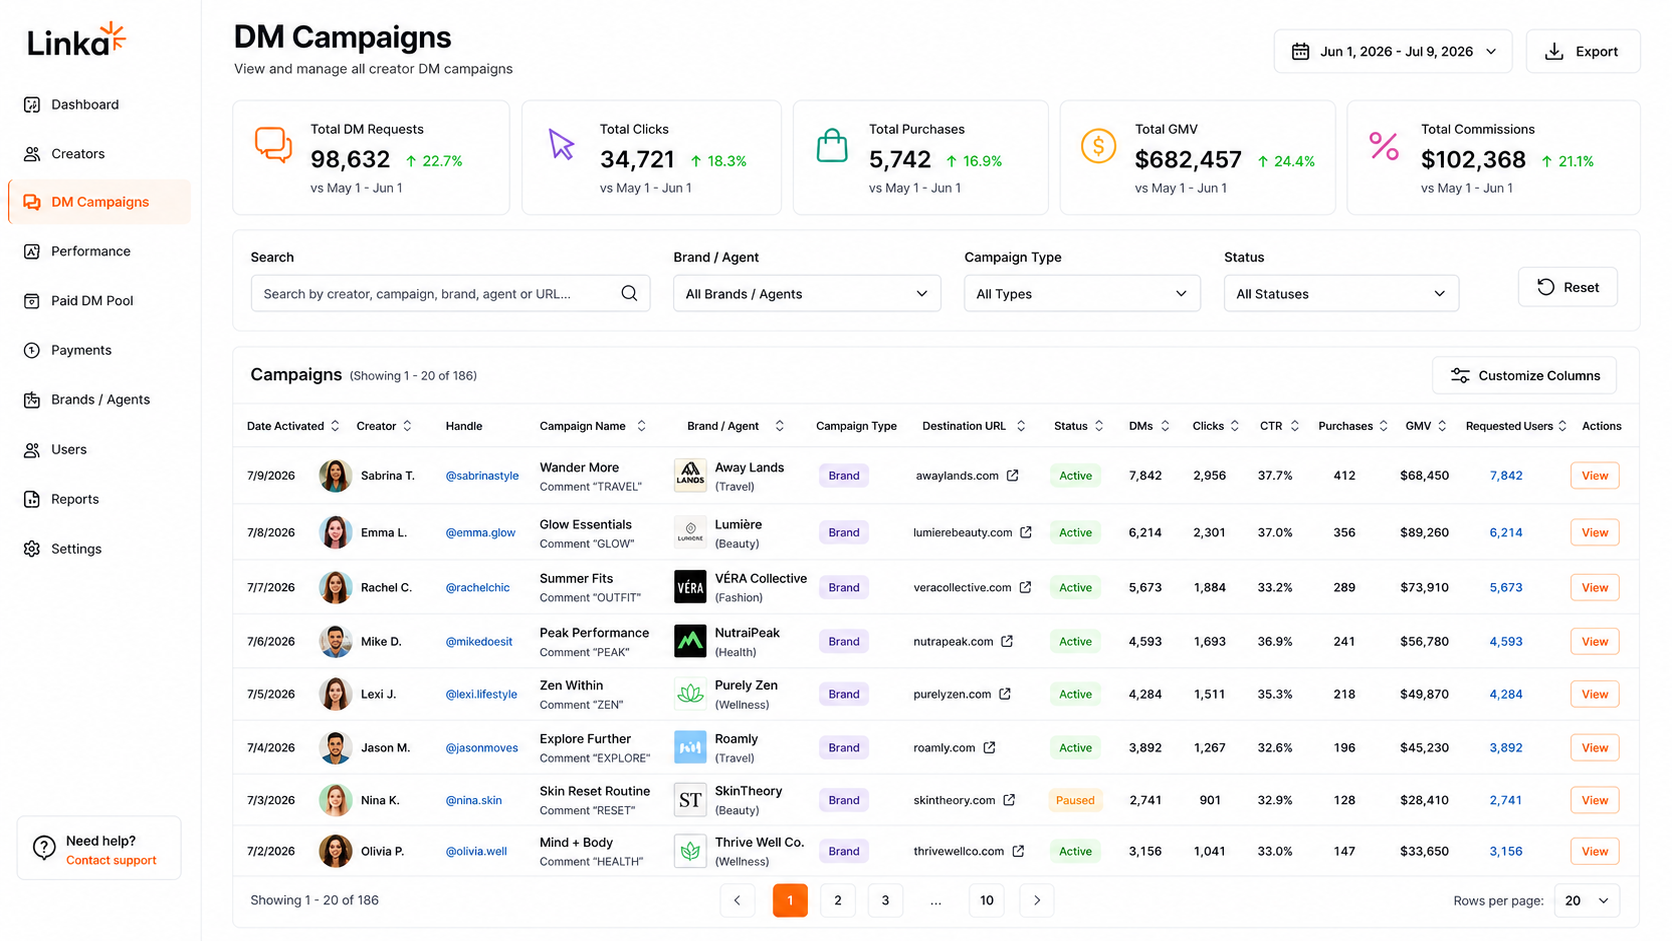
Macro still has a job worth paying for, which is category entry and credibility transfer into a market where nobody knows your name. The mistake isn't buying macro. It's buying macro and then judging it against a conversion target it was never structured to hit. Linka's dashboard analytics helps brands determine which creators are getting the most DMs and sales conversions.
Settling Micro vs Macro Influencers Conversion Rate With Your Own Data
Published benchmarks describe someone else's category, price point, and audience. Cost per DM (CPDM™) settles the tier question inside your own campaign instead, because it normalizes across every tier at once. It doesn't care how many followers produced the conversation, only what that conversation cost and where it went. Running a mixed roster on a single shared unit turns the comparison into something empirical within one campaign cycle. Here’s what that looks like:
- One Unit Across Every Tier: CPDM™ rewards creators for qualified buyer conversations at twenty-five cents per DM, so a 9,000-follower account and a 400,000-follower account get measured identically.
- Commissions On What Follows: You set the affiliate rate, and purchases through a creator's AI shop or links are tracked and paid automatically, putting conversation cost next to revenue earned.
- Creator Performance Side By Side: One dashboard reports qualified DMs, clicks, purchases, commissions, GMV, and conversion rates per creator in real time.
- Conversation-Level Detail: You see what buyers asked, what they objected to, and what pushed them toward purchase, rather than which tier posted more.
- A Roster Wide Enough to Test: 18,000+ creators choose your campaign from the marketplace, so your mix reflects who genuinely wants to promote the product.
Frequently Asked Questions About Micro vs Macro Influencers Conversion Rate
Do micro influencers really convert better than macro influencers?
They generally show higher engagement rates, and that finding is consistent across sources. The honest answer is that engagement rate and conversion aren't the same measurement, and the tier that wins depends on which one you're tracking.
How many creators should a brand work with?
Enough to produce a reliable volume of buying conversations, which depends on category and price point rather than a fixed number. A useful approach is to run a small mixed roster first, measure how many qualified questions each tier generates per dollar, then scale toward whichever tier performs in your specific category.
Why do influencer engagement benchmarks vary so much between sources?
Because methodologies differ on platform, content format, date range, and how engagement itself is defined. Instagram Reels and static posts produce very different rates from the same account, so any benchmark that doesn't control for format is blending two different behaviors into one number. Treat published benchmarks as orientation and your own campaign data as the actual answer.
Find Your Own Micro vs Macro Influencers Conversion Rate
The benchmark disagreement doesn't get resolved by reading more studies. It gets resolved by running a mixed roster where every tier is priced on the same unit. Linka connects your affiliate program, opens your campaign to 18,000+ creators in the marketplace, and turns comments into qualified DMs through Meta-approved Comment-to-DM on Instagram, with qualified DMs, clicks, purchases, commissions, and GMV reported per creator in real time.
Curious which tier actually converts for your category? See how performance-based creator campaigns compare creators on the same terms, and find out what your own data says.

.webp)
.jpg)
.jpg)